www.fluorescencemicroscopy.it
Main menu:
- Home Page
- Microscopes
- Fluorescence
- Description
- Diascopy
- Epi-Fluoresc.
- Illumination
- Installing and Aligning a Mercury Lamp
- Fluorocromes
- Tables of Fluorocromes
- The Fading
- Wavelengths
- Properties
- % of transmission
- Types of filters
- Overlapping Spectra
- Intensity
- Image acquisition
- The Filter's set
- The Filters
- Fluorochrome's praparation
- Sample's preparations
- Fluorescence Sample
- Cytochemical Fluorescence
- Intrinsic Fluorescence
- Gallery
- Phase Contrast
- Polarization
- Darkfield
- DIC
- COL
- Rheinberg
- Brightfield
Fluorocromes
Fluorescence
The Fluorocromes
The fluorochrome is one of the essential components for fluorescence microscopy. The choice of fluorochrome used is the key you want to analyze the sample and the results you get. The particularity of this substance is to absorb photons of a certain wavelength and show, as a result, fluorescence. The electrons passing from the excited state to a resting state loses energy. The consequence of this loss is the shift of the emission spectrum of the fluorochromes at wavelengths longer than the absorption spectrum (excitation). Note that the wavelength varies inversely to the energy of radiation. This phenomenon is known as Stokes Law or Stokes shift. The size of the "shift" varies with the molecular structure, but can vary from a few nanometers to over several hundred nanometers. For example, the Stokes shift for Fluorescein is approximately 20 nanometers, while Hoechst 33258 is 120 nanometers and that for Acridine Orange (+ RNA) is about 200 nanometers. The use of optimal filters is designed to increase the value of the shift and, consequently, easier to separate the excitation light.
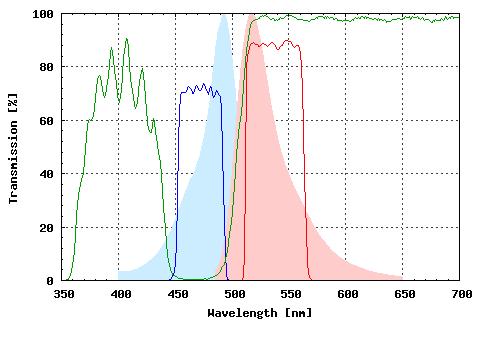
The curve represents the emission spectrum in the fluorochromes is usually lower than or equal in intensity compared to the curve of excitation. In the graphic representation the two curves have an almost specular image. For example see the curves of the fluorophore FITC in the figure below, which absorbs in the region of blue-green and produces an emission green-yellow. To obtain maximum light, the fluorochromes are usually excited at the absorption peak. The selection of wavelengths of excitation and emission occurs through interference filters. In addition, the spectral response of the optical system is also dependent on other factors such as the transmission efficiency of the lenses, the type and power of the light source, the type of fluorochrome used.

There are several types of fluorophores, which are characterized by different absorption and emission spectra.
The fluorophore can be purchased in powder or in solution, in both cases must be diluted in water or PBS, they are subject to decay, so you need to create a stock solution that must be kept in the dark at low temperature, creating time to Once the solution to be used at the time.
The following table is to give you an indication on the use of various fluorochromes in fluorescence microscopy.
It is indicated, for each fluorophore, band of the excitation and emission, type and the possible ways of solution, the staining time and scopes.
FLUOROCHROME |
EXC |
EMIT |
Solution Type |
Staining's time |
APPLICATION
|
HOECHST 3258 |
346 |
460 |
buffer/water |
10-30 m. (bacteria) |
Marking DNA, chromosomes and nuclei. Staining |
Acridyne Orange |
460 |
650 |
tampone fosfato |
3 min |
Differentiation of DNA and RNA |
BO (Thiazole Yellow) |
460 |
480 |
3 min. |
DNA |
|
BOBO-1 |
462 |
481 |
30 min. (< at high concentration) |
DNA |
|
Dye 307 |
485 |
590 |
anionic detergent contining buffer |
5 min. |
Staining of proteins in solution, membranes of living cells or fixed |
Nile Red |
485 |
525 |
5 min. |
Intracellular lipids, hydrophobic part of proteins, staining of lysosomal phospholipid inclusions |
|
Fluorescein |
494 |
518 |
buffer Ph 9 |
30 min. |
Marking of proteins and nucleic acids |
Carboxyfluorescein |
492 |
518 |
buffer Ph 8 |
15 min. |
Fluorescent dyes, amino-reactive for the long-term analysis, generation and proliferation of cells |
Acridyne Orange (+DNA) |
500 |
526 |
tampone fosfato |
3 min. |
Differentiation of DNA and RNA |
Rhodamine G |
502 |
527 |
|||
TOTO-1 |
509 |
533 |
1 hour (< at high concentration) |
Plant cells |
|
Thiazole Orange |
509 |
530 |
buffer Ph 7 |
3 min. |
Analysis of reticulocyte |
Heptyl-thiazole Orange |
515 |
535 |
Plant cells |
||
N-desmethyl- thiazole Orange |
515 |
535 |
Plant cells |
||
Carboxyeosin |
515 |
542 |
buffer Ph 9 |
15 min. |
Ph indicator range for acids, amine-modified marker and conjugated proteins |
EOSIN |
524 |
544 |
Ph 7 |
3-5 min. |
Histology - Staining of the cytoplasm |
Erythrosin |
529 |
544 |
Ph 7 |
3-5 min. |
Histology - Staining of the cytoplasm |
Rhodamine B |
555 |
580 |
15 min. |
Staining of mycobacteria - bacterial smears |
|
Carboxyrhodamine B |
556 |
581 |
buffer Ph 9 |
||
P2 (Pyrillium) |
580 |
640 |
5 min. |
Sub-Menu:
- Description
- Diascopy
- Epi-Fluoresc.
- Illumination
- Installing and Aligning a Mercury Lamp
- Fluorocromes ←
- Tables of Fluorocromes
- The Fading
- Wavelengths
- Properties
- % of transmission
- Types of filters
- Overlapping Spectra
- Intensity
- Image acquisition
- The Filter's set
- The Filters
- Fluorochrome's praparation
- Sample's preparations
- Fluorescence Sample
- Cytochemical Fluorescence
- Intrinsic Fluorescence
- Gallery